Building a Large-Scale Server Monitor
2017-01-24
Some insight into the development of Platypus
If you've been around for a while, you may be aware I work at GGServers as a developer primarily focused on exploring new areas of technology and computing. My most recent project has been Platypus, a replacement to our very old status page (here, yes we know it's down). Essentially, I had three goals I needed to fulfil.
- [Able to check whether a panel (what we refer to our servers as, for they host the Multicraft panel) within our large network is offline. This is by far the easiest part of the project, however implementation and accuracy was a problem.]
- [Be able to fetch server usage statistics from a custom script which can be displayed on a webpage so we can accurately monitor which servers are under or over utilised.]
- [Build a Slack bot to post updates of downed panels into our panel reporting channel.]
Some Rationale

Why did you choose Python? Why not Node.js or even PHP (like our current status page)? Well, I wanted to learn Python, because it's a language I never fully appreciated until I built tfbots.trade (which is broken, I know, I haven't gotten around to fixing it). At that point, I sort of fell in love with the language, the wonderful syntax and PEP8 formatting. Regardless of whether I loved it or not, it is also a hugely important language in the world of development, so it's worth learning.
Why do you use JSON for all the data? I like JSON. It's easy to work with, with solid standards and is very human readable.
Tackling Panel Scanning
Right so the most logical way to see if a panel is down is to make a request and see if it responds. So that's what I did. However there were a few gotchas along the way.
First, sometimes our panels aren't actually down, but just take a little bit to respond because of various things like CPU load, RAM usage, etc., so I needed to determine a timeout value so that scanning doesn't take too long (CloudFlare adds some latency between a client and the actual "can't reach server" message). Originally, I had this set to one second, thinking that even though my own internet isn't fast enough, the VPS I deployed it to should have a fast enough network to reach them. This turned out to not be true -- I eventually settled on 5 seconds, which is ample time for most panels to respond.
Originally I believed that just fetching the first page of the panel (in our case, the login for Multicraft), would be effective enough. Unfortunately what I did not consider is all the legwork the panel itself has to do to render out that view (Multicraft is largely PHP-based). But fortunately, the request doesn't really care about the result it gets back (yet). So to make it easier, I told the script to get whatever is in the /platy/ route. This of course makes it easier for deployment of the stat scripts, but I'll get to those in a bit.
Caching the results of this scan is taken care of by my useful JSON caching Python module, which I haven't forked off because I don't feel it's very fleshed out. That said, I've used it in two of my handful of Python projects (tfbots and Platypus) and it has come in very handy (here's a gist of it). It handles writing and reading cache data with no outside modules aside from those shipped with Python.
Stat Scripts
An integral part of a status page within a Minecraft hosting company is being able to see the usage stats from our panels. I wrote two scripts to help with this, one in Python and one in PHP, which both return the same data. It wasn't completely necessary to write two versions, but I was not sure which one would be favoured for deployment, and I figured PHP was a safe bet because already we have PHP installed on our panels. The Python script was a backup, or if others wanted to use Platypus but without the kerfuffle of PHP.
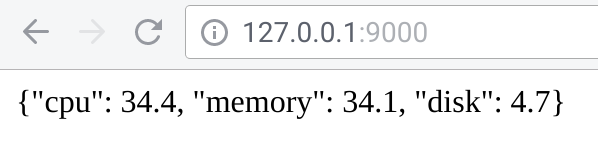
The script(s) monitor three important usage statistics; CPU, RAM and disk space. It returns this info as a JSON array, with no extra frills. The Python script implements a minimal HTTP server to handle requests as well, and only relies on the psutil module for getting stats.
Perry the Platypus
Aka the Slack bot, which we have affectionately nicknamed. This was the most simple part of the project to implement thanks to the straightforward library Slack has for Python. Every hour, he/she/it (gender undecided, let's not force gender roles people! /s) posts to our panel report channel with a list of the downed panels. This is the part most subject to change as well, because after a while it feel a lot like a very annoying poke in the face every hour.
→Going Forward →
I am to continue to work on Platypus for a while; I am currently implementing multiprocessing so that when it scans for downed panels, the web server can still respond. I am having some funky issues with that though, namely the fact Flask seems to be blocking the execution of functions once it is started. I'm sure there's a fix, I just haven't found it yet. I also want to make the frontend more functional -- I am definitely implementing refreshing stats with as little JavaScript as possible, and maybe making it slightly more compact and readable. As for the backend, I feel like it's pretty much where it needs to be, although it could be a touch faster.
Refactoring the code is also on my to do list, but that is for much, much farther down the line.
I also need an adorable logo for the project.